
User:ILHAN Ayse/Colette Cauvin
ILHAN Ayse/Colette Cauvin | |
|---|---|
Catégorie:Article utilisant une Infobox
Colette Cauvin or Colette Cauvin-Reymond, born on April 1, 1944 in Draguignan, is a une geoprapher and a french cartography. Her career is marked by the computerization of geography and cartography, in which she participates while bringing a critical eye, and by her commitment to the development of quantitative geography in France. She disseminates the techniques of the American Waldo Tobler, in particular two-dimensional regression, and provides additional information in spatial analysis. Her work is widely echoed by being applied in studies, for example for SNCF and DATAR. She develops the cartographic anamorphoses to which her name is attached in France and participates in the dissemination of piezopleth maps designed by Charles Schneider. Colette Cauvin partially formalizes the geography of perception, proposes the concept of "functional space" and works on cognitive maps. Her work aims both to explore new ways of representing geographic data and to study their limits.
Biography[edit]
Colette Cauvin born on April 1, 1944 in Draguignan completed part of her secondary studies in Metz[1]’[2]. Passionate about mathematics, she nevertheless does not see its practical applications[3]. She therefore embarked on studies in geography, which she saw as a good balance between literary and scientific studies.[3]. Little attracted by competitions and jobs in secondary education, she chose to enter the Faculty of Strasbourg for this reason in 1963.[3]. Thanks to the free license systems, she follows an open course in geography and cartography and has Sylvie Rimber as a teacher.[3].She initially devoted herself to rural geography in tropical Africa where she mobilized economic mathematics.[3]’[2] She then specialized in cognitive geography and quantitative geography until her doctorate in 1984 and then defended her authorization to direct research in 1985.[1].It was during a secondment for this research in 1981 and 1982 at the University of Alberta and the University of California at Santa-Barbara that she deepened her knowledge of the work of Waldo Tobler and Reginald Golledge.’[2]’[3].
The majority of her career takes place at the University of Strasbourg, where she develops with Sylvie Rimbert and Henri Reymond original research themes in quantitative geography and cartography in a context where Paris is the reference.[4]’[5]. She gradually set up courses in quantitative geography and analytical cartography at the University of Strasbourg.[4].A member of the human geography laboratory in Strasbourg, Colette Cauvin became its director in 1991, before creating the Image et Ville laboratory in 1995 and taking over as its director.[3]’[1]. Since 2004, she has become a honorable teacher.[2]
-
The University Palace of the University of Strasbourg
-
Alberta University
-
California University in Santa Barbara
Works[edit]
The work of Colette Cauvin is first in the fields of cartography, then in theoretical and quantitative geography and finally in the geography of perception.[1].
Early in her career, she breaks down maps with layers[6]. In two decades, after 1980, once the problems of cost, heaviness and complexity have been solved, data processing becomes dematerialized[7]’[8]. Colette Cauvin accompanies the computerization of cartography, explores its tracks while pointing out its limits, such as the fact that everyone can create a cartographic image without respecting its rules of construction[6]’[7].
Contribution to quantitative geography[edit]
In a context where computers make it possible to process and analyze more and more data, Colette Cauvin takes part in the theoretical and quantitative revolution.[9]. Like many people in this specialty, she is trained in statistics and mathematics, which are not very present in the classical geography curriculum.[10]’[11].
In 1976, Colette Cauvin and Sylvie Rimbert published a first book on spatial analysis with a synthesis of different clues to describe a closed geometric shape, such as a town[12]. They point out its limits: these clues, taken from geography, physics, biology, mathematics etc. aim to compare with classic shapes in geometry (square, circle, ellipse, etc.)[12]. As a result, for different geographical shapes, the same index can be obtained as a result: "the shape is very difficult to measure"[12]’[13].
Colette Cauvin shows the interest of anamorphoses for demography or electoral maps which allow the eye to better perceive the geographical distribution and the weight of the voting population.[14]’’[7].

Colette Cauvin and Henri Reymond also point out the use cases and the limits, depending on the distribution of the data but also the difficulties of reading this type of map[15]’[16]. This mapping thus offers the possibility of bringing out underlying relationships or extracting characteristics that are not directly visible.[17]. The work in accessibility that Colette Cauvin develops with Henri Reymond from 1982 reveals the contributions of this cartography: the associated anamorphoses making it possible to visualize the impact of the changes introduced by the new modes of transport.

She participates in the dissemination of piezopleth maps designed by Charles Schneider and published in a scientific article in 1989[18]. The piezopleth map (from the Greek piezo, force or pressure) is adapted from calculations of the resistance of materials in physics and that of structures in civil engineering[18].


In 1984, as part of her thesis, Colette Cauvin mobilized the comparison of maps by two-dimensional regression, a method created by Waldo Tobler[1]’[19]. This cartographic technique, inspired by D'Arcy Thompson's work on shapes, allows two homologous surfaces to be compared with each other.[20]. Applied to cartography, it makes it possible to compare points in a geographical space with corresponding points in another domain (travel time, intensity of exchanges), which leads to a deformation of the initial geographical space.[20]’[1]. Space then translates time-distances and no longer geographical distances.. Colette Cauvin studies the work of Waldo Tobler then presents for the first time in France these models developed by the researcher[7]. She disseminates the method in France and applies these different practices of transformational mapping to spatial analysis.[21]’[22].
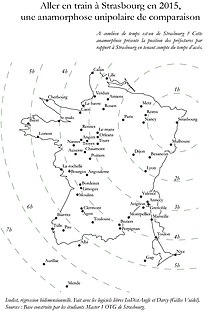
With the objective of better communication of the cartographic message, these cartographic transformations are mobilized by the planning departments or by the DATAR to show the savings in travel time thanks to the TGV. They are widely disseminated within SNCF and in the press. "Tortorers" of maps according to Jean-Christophe Gay, these anamorphoses are also offered in the Atlas de France of the GIP RECLUS. A synthesis of the work and the way of representing the data is detailed with a critical aspect in the five volumes of Thematic Cartography’.
These achievements are possible thanks to computers (such as SYMAP, the first computer-assisted mapping program)[7]. To be able to produce these new types of cards, Colette Cauvin's team participates in the development of specific software for which Colette Cauvin writes the instructions (Anaplaste, Darcy,...)[23]’[24]’[25]’[26].
Colette Cauvin's research on the visualization of digital data by cartographic transformations, as well as their originality, are highly recognized in France by associating her name with anamorphoses[8]’[27]’[28]’[29].
Epistemology of quantitative geography[edit]
Colette Cauvin carries out a study on the diffusion of French theoretical and quantitative geography which first developed to the northeast of a line running from Montpellier to Rennes[30].
Contribution to the geography of perception[edit]
Colette Cauvin partially formalizes the geography of perception and develops it thanks to the contributions of psychology in cognitive geography[31]’[1]’. She studies the representations of the city by the inhabitants, that is to say the subjective space, to understand their behavior and their feelings.[31]. It shows that our cognitive space is constructed not only thanks to our experience of the field, but also by external elements, such as readings or during conversations with other people.[31]. She calls "functional spaces" a selection of places where movements and displacements take place, the purpose of which is to allow the accomplishment of an action.[32]. This selection depends on the characteristics and personal experience of individuals[32]. These places have not always been traveled, but we can know them thanks to different beliefs and information obtained indirectly. Their knowledge is therefore both individual and collective.[32]. Thanks to two-dimensional regression, Colette Cauvin compares this functional space to the geographical space.
Colette Cauvin also shows that with GPS, we are focused on the only route and deprived of the landmarks and the complete vision of the environment offered by a geographical map: the places are no longer connected to others in our mind.[33].
She explores the perception of space of different audiences (children) and uses cognitive maps. The latter are carried out by the people whose knowledge of space is sought to be identified and explained.[32]. On these maps, the closer the space to be drawn, the more important its place on the map; on the contrary, distant spaces are vague and small, which brings mental maps closer to anamorphoses[34]. Depending on what is, or is not, represented, we can thus identify the filters of perception[35]. This led him to work on this theme with Henri Reymond and to apply it with his team to several projects on cities.[1]. However, Colette Cauvin points out the different problems of interpreting these cognitive maps: research must differentiate knowledge of the space and the ability to report on it by the people who make the map.[35].
Publications[edit]
Works[edit]
- Cauvin, Colette; Serradj, Abdelaziz; Escobar, Francisco (impr. 2007). Cartographie thématique. 1, Une nouvelle démarche. Hermes Science. ISBN 978-2-7462-1252-7. OCLC 493753431.
{{cite book}}:|access-date=requires|url=(help); Check date values in:|date=(help) - Cauvin, Colette; Serradj, Abdelaziz; Escobar, Francisco (impr. 2007). Cartographie thématique. 2, Des transformations incontournables. Hermes Science. ISBN 978-2-7462-1252-7. OCLC 493811155. Retrieved 2021-09-21.
{{cite book}}: Check date values in:|date=(help) - Cauvin, Colette; Serradj, Abdelaziz; Escobar, Francisco (impr. 2008). Cartographie thématique. 3, Méthodes quantitatives et transformations attributaires. Hermes Science. ISBN 978-2-7462-1252-7. OCLC 494912137. Retrieved 2021-09-21.
{{cite book}}: Check date values in:|date=(help) - Cauvin, Colette; Serradj, Abdelaziz; Escobar, Francisco (impr. 2008). Cartographie thématique. 4, Des transformations renouvelées. Hermes Science. ISBN 978-2-7462-1252-7. OCLC 494911729. Retrieved 2021-09-21.
{{cite book}}: Check date values in:|date=(help) - Cauvin, Colette; Serradj, Abdelaziz; Escobar, Francisco (impr. 2008). Cartographie thématique. 5, Des voies nouvelles à explorer. Hermes Science. ISBN 978-2-7462-1252-7. OCLC 494910604. Retrieved 2021-09-21.
{{cite book}}: Check date values in:|date=(help) - Cauvin, Colette; Hirsch Louis-Jean), Jacky; Reymond, Henri (1985). L'Espacement des villes : théorie des lieux centraux et analyse spectrale. Éd. du Centre national de la recherche scientifique. ISBN 2-222-03651-8. OCLC 416935960. Retrieved 2021-09-21.
- Cauvin, Colette; Escobar, Francisco; Serradj, Aziz (2013). Thematic cartography, thematic cartography and transformations. Wiley-ISTE. ISBN 978-1-118-61951-3. OCLC 1103921278. Retrieved 2021-09-21.
- Cauvin, Colette; Serradj, Aziz; Escobar, Francisco (2010). Cartography and the impact of the quantitative revolution. ISTE. ISBN 978-1-118-58711-9. OCLC 827208475. Retrieved 2021-09-21.
- Reymond, Henri; Cauvin, Colette; Kleinschmager, Richard (1998). L'espace géographique des villes : pour une synergie multistrates. Anthropos. ISBN 2-7178-3704-3. OCLC 301599145. Retrieved 2021-09-21.
- Cauvin, Colette (1984). La perception des distances en milieu intra-urbain : une première approche. Editions du CDSH. ISBN 2-7359-0012-6. OCLC 17385969. Retrieved 2021-09-21.
- Cauvin, Colette; Rimbert, Sylvie (1976). La lecture numérique des cartes thématiques. Éditions universitaires de Fribourg. ISBN 2-8271-0109-2. OCLC 3391493. Retrieved 2021-09-21.
Articles[edit]
- Cauvin, Colette; Schneider, Charles (1989-12-01). "Cartographic transformations and the piezopleth maps method". The Cartographic Journal. 26 (2): 96–104. doi:10.1179/caj.1989.26.2.96. ISSN 0008-7041. Retrieved 2022-05-07.
- Cauvin, Colette (1999-01-27). "Pour une approche de la cognition spatiale intra-urbaine". Cybergeo: European Journal of Geography (in French). doi:10.4000/cybergeo.5043. ISSN 1278-3366. Retrieved 2022-05-07.
- Cauvin, Colette (1997-01-14). "Au sujet des transformations cartographiques de position". Cybergeo: European Journal of Geography (in French). doi:10.4000/cybergeo.5385. ISSN 1278-3366. Retrieved 2022-05-07.
- Cauvin, Colette; Reymond, Henry (1991). "Interaction spatiale et cartographie : les solutions de W. Tobler". Espace Populations Sociétés. 9 (3): 467–485. doi:10.3406/espos.1991.1489. Retrieved 2022-05-07.
Exhibition[edit]
- « Des cartes à la carte », traveling exhibition presented in Strasbourg in early 2010, then in Paris (international cartography conference in 2011), Besançon, Luxembourg et à Alcalá de Henares en Espagne[36]. She presents in particular the maps published in the five volumes of Thematic Cartography and is the subject of an English translation.[37].
Notes and references[edit]
Notes[edit]
References[edit]
- ^ a b c d e f g h "Colette CAUVIN - Dictionnaire créatrices". www.dictionnaire-creatrices.com. Retrieved 2021-09-21.
- ^ a b c d "GeoCarto - site personnel de Colette Cauvin". www.geocarto.eu. Retrieved 2022-02-10.
{{cite web}}: Invalid|url-access=libre(help) - ^ a b c d e f g Sylvain Cuyala (2014). "Analyse spatio-temporelle d'un mouvement scientifique" (pdf). Thèse de doctorat: 111.
{{cite journal}}: Invalid|url-access=libre(help) - ^ a b Laura Péaud; Sylvain Cuyala (2016). "Structuration de la vie de laboratoire en géographie théorique et quantitative : les mémoires de l'équipe P.A.R.I.S". Lieux Communs - Les Cahiers du LAUA (18): 175-196.
{{cite journal}}: Invalid|url-access=libre(help) - ^ Ginsburger, Nicolas (2017-10-26). "Femmes en géographie au temps des changements". L’Espace géographique. Tome 46 (3): 236–263. doi:10.3917/eg.463.0236. ISSN 0046-2497. Retrieved 2022-02-20.
- ^ a b Gilles Fumey (2 janvier 2018). "Le monde comme une pâtisserie". Libération.
{{cite journal}}: Check date values in:|date=(help) - ^ a b c d e Désiré-Marchand, Joëlle (1991). "Editorial : Cartographie des populations : quelques réflexions". Espace Populations Sociétés. 9 (3): 445–449. Retrieved 2022-03-07.
- ^ a b Gosme, Cyril; Association pour la diffusion de la pensée française (2006). Couvrir le monde : un grand XXe siècle de géographie française. Association pour la diffusion de la pensée française. p. 81. ISBN 2-914935-44-7. OCLC 70065532. Retrieved 2022-03-07.
{{cite book}}: Missing|author1=(help); More than one of|pages=and|page=specified (help) - ^ "Tendances diverses de la représentation cartographique". Annales de géographie. 90 (501): 513–534. 1981. doi:10.3406/geo.1981.20038. Retrieved 2022-02-11.
- ^ "Partie IV. Les révolutions computationnelles : de l'analyse à la synthèse". Théories et modèles en sciences humaines : le cas de la géographie. p. 375-603. ISBN 978-2-37361-127-4. OCLC 1015308768. Retrieved 2022-02-20.
- ^ Cauvin, Colette (2007-10-03). "Géographie et mathématique statistique, une rencontre d'un nouveau genre". La revue pour l’histoire du CNRS (in French) (18). doi:10.4000/histoire-cnrs.4131. ISSN 1298-9800. Retrieved 2022-02-20.
- ^ a b c Chareille, Pascal; Rodier, Xavier; Zadora-Rio, Elisabeth (2004-12-02). "Analyse des transformations du maillage paroissial et communal en Touraine à l'aide d'un SIG". Histoire & mesure (in French). XIX (3/4): 317–344. doi:10.4000/histoiremesure.772. ISSN 0982-1783. Retrieved 2022-02-20.
- ^ Rimbert, Sylvie; Colette Cauvin (1976). La lecture numérique des cartes thématiques. Éditions universitaires de Fribourg. ISBN 2-8271-0109-2. OCLC 3391493. Retrieved 2022-02-20.
- ^ Colette Cauvin; Étienne Jund; Richard Kleinschmager; Henri Reymond (1989). "Images des élections présidentielles en France" (pdf). Mappemonde.
{{cite journal}}: Invalid|url-access=libre(help) - ^ Cauvin, Colette; Reymond, Henri (1986). Nouvelles méthodes en cartographie. GIP RECLUS. p. 56. ISBN 2-86912-005-2. OCLC 300000644. Retrieved 2022-02-20.
- ^ Dumolard, Pierre (1999). "Accessibilité et diffusion spatiale". L'Espace géographique. 28 (3): 205–214. doi:10.3406/spgeo.1999.1254. Retrieved 2022-03-07.
- ^ Cauvin, Colette (1997-01-14). "Au sujet des transformations cartographiques de position". Cybergeo: European Journal of Geography (in French). doi:10.4000/cybergeo.5385. ISSN 1278-3366. Retrieved 2022-02-10.
- ^ a b Cauvin, C.; Schneider, C. (1989-12-01). "Cartographic transformations and the piezopleth maps method". The Cartographic Journal. 26 (2): 96–104. doi:10.1179/caj.1989.26.2.96. ISSN 0008-7041. Retrieved 2022-03-07.
- ^ Conversation, Cybergeo. "Waldo Tobler (1930-2018)". cybergeo conversation (in French). Retrieved 2022-03-07.
- ^ a b Roulier, Frédéric (2018-02-21). "Une adaptation de la régression bidimensionnelle aux polygones : un exemple en cognition spatiale". Cybergeo: European Journal of Geography (in French). doi:10.4000/cybergeo.29082. ISSN 1278-3366. Retrieved 2022-03-14.
- ^ Thévenin, Thomas; Schwartz, Robert; Sapet, Loïc (2013). "Mapping the Distortions in Time and Space: The French Railway Network 1830-1930". Historical Methods: A Journal of Quantitative and Interdisciplinary History. 46 (3): 134–143. doi:10.1080/01615440.2013.803409. Retrieved 2022-02-11.
- ^ Cite error: The named reference
:4was invoked but never defined (see the help page). - ^ "Darcy". sourcesup.renater.fr. Retrieved 2022-02-10.
- ^ "Anaplaste". sourcesup.renater.fr. Retrieved 2022-02-10.
- ^ Lambert, Nicolas; Bahoken, Françoise; COME, Etienne (2021-06). "Vers une relecture du Flowmapper - Tribute to Tobler (TTT)". Tous (im)mobiles, tous cartographes ? Cartomob: 9p. Retrieved 2022-02-11.
{{cite journal}}: Check date values in:|date=(help) - ^ Lambert, Françoise Bahoken et Nicolas. "Le Flowmapper de Tobler (1979)". Carnet (neo)cartographique (in French). Retrieved 2022-02-12.
- ^ La représentation des données géographiques : statistique et cartographie. 2017. p. 247. ISBN 978-2-200-61782-0. OCLC 990192209. Retrieved 2022-03-07.
- ^ Christine Tobelem-Zanin (2016). "Autres visages cartographiques". Manuel de cartographie : principes, méthodes, applications. Armand Colin. p. 151. ISBN 978-2-200-61285-6. OCLC 950006051.
{{cite book}}:|access-date=requires|url=(help); Missing|author1=(help) - ^ Cauvin, Colette (1996-06-14). "Bibliographie sur les transformations cartographiques". Cybergeo: European Journal of Geography (in French). doi:10.4000/cybergeo.146. ISSN 1278-3366. Retrieved 2022-03-07.
- ^ Cuyala, Sylvain; Commenges, Hadrien (2014-12-17). "La diffusion de la « géographie théorique et quantitative » en France : quel modèle de diffusion spatiale ?". L’Espace géographique. Tome 43 (4): 289–307. doi:10.3917/eg.434.0289. ISSN 0046-2497. Retrieved 2022-02-20.
- ^ a b c Pichon, Matthieu (2015-03-01). "Espace vécu, perceptions, cartes mentales : l'émergence d'un intérêt pour les représentations symboliques dans la géographie française (1966-1985)". Bulletin de l’association de géographes français. Géographies (in French). 92 (1): 95–110. doi:10.4000/bagf.502. ISSN 0004-5322. Retrieved 2022-03-14.
- ^ a b c d Pasini, Jérémy (2021-10-20). "Quel rôle l'utilisation du téléphone portable joue-t-il dans la construction des compétences de mobilité au Cameroun ?". Netcom. Réseaux, communication et territoires (in French) (35-1/2). doi:10.4000/netcom.5702. ISSN 0987-6014. Retrieved 2022-03-14.
- ^ Leportois, Daphnée (2019-09-24). "Le GPS vous fait perdre le nord". korii. (in French). Retrieved 2022-04-15.
- ^ Philippe Rekacewicz (2021). "Pourquoi faire autrement ?". Cartographie radicale : explorations. La découverte. p. 194. ISBN 978-2-37368-053-9. OCLC 1277145774. Retrieved 2022-03-07.
{{cite book}}: Missing|author1=(help); More than one of|pages=and|page=specified (help) - ^ a b Grasland, Claude; Baron, Myriam; Bennasr, Ali; Brennetot, Arnaud (2017-03-31). "Réformes régionales en France et en Tunisie. Éléments théoriques et méthodologiques pour cerner les territoires perçus:". Maghreb - Machrek. N° 226 (4): 73–96. doi:10.3917/machr.226.0073. ISSN 1762-3162. Retrieved 2022-03-14.
{{cite journal}}:|volume=has extra text (help) - ^ "L'Actu Numéro 20 - Edition du 29/01/2010 - Culture - Art - Sciences". numero20.lactu.unistra.fr. Retrieved 2022-02-11.
{{cite web}}: no-break space character in|title=at position 7 (help) - ^ Exposition Cartographie thématique Des cartes à la carte. 2010. p. 4.
See also[edit]
Bibliography[edit]
Sources utilisées pour la rédaction de cet article[edit]
- "Colette CAUVIN - Dictionnaire créatrices". www.dictionnaire-creatrices.com. Retrieved 2022-04-15.
- Sylvain Cuyala (2014). "Analyse spatio-temporelle d'un mouvement scientifique" (pdf). Thèse de doctorat: 111.
{{cite journal}}: Invalid|url-access=libre(help)
External links[edit]
- Site officiel
- Research Resources :
- Hyper articles en ligne
- Persée
- ResearchGate
- (en) ORCID
- (mul) Scopus
- Notices d'autorité :
- Fichier d’autorité international virtuel
- International Standard Name Identifier
- Bibliothèque nationale de France (données)
- Système universitaire de documentation
- Bibliothèque du Congrès
- Gemeinsame Normdatei
- Bibliothèque royale des Pays-Bas
- Bibliothèque universitaire de Pologne
- Bibliothèque nationale de Catalogne
- Réseau des bibliothèques de Suisse occidentale
- Bibliothèque nationale du Portugal
- WorldCat
Related articles[edit]
- The Geography Portal
- The Geographical Information Portal
[[Category:20th-century geographers]] [[Category:University of Strasbourg faculty]] [[Category:University of Strasbourg alumni]] [[Category:Women geographers]] [[Category:French geographers]] [[Category:Articles with authority control information]]