
File:Geothermal heat map US.png

Original file (1,892 × 1,247 pixels, file size: 65 KB, MIME type: image/png)
| This is a file from the Wikimedia Commons. Information from its description page there is shown below. Commons is a freely licensed media file repository. You can help. |
Transwiki approved by: w:en:User:Dmcdevit
This image was copied from wikipedia:en. The original description was:
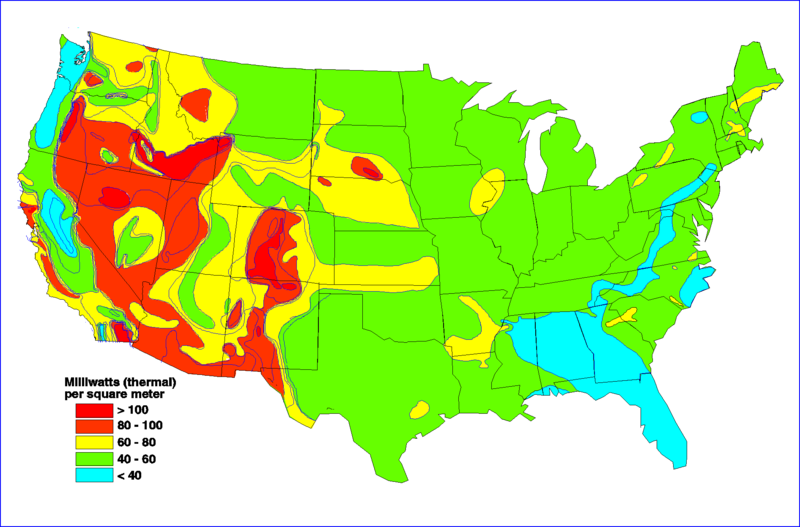
Heat Flow Contours of the United States.
Drawing not to scale.
Heat flow contours are patterned in intervals of 20 milliwatts per square meter (mW/m²). Highest temperatures will be associated with areas that have both high heat flow and rock strata with high thermal conductivity.
The area along the San Andreas fault has moderate to high heat flow. In fact, The Geysers geothermal system is associated with the tectonic effects of the San Andreas fault system. The Sierra Nevada Mountains are notable as one of the lowest heat flow and crustal temperature areas on earth.
Source: w:en:Energy Information Administration, Geothermal Energy in the Western United States and Hawaii: Resources and Projected Electricity Generation Supplies, DOE/EIA-0544 (Washington, DC, w:en:September w:en:1991); Modified after the Geothermal Map of North America, prepared as part of the Geological Society of North America Decade of North America Geology (DNAG), from Blackwell, D.D., and Steel, J.L., Mean Temperature in the Crust of the United States for Hot Dry Rock Resource Evaluation (Southern Methodist University, w:en:May w:en:1990), pp. 6-8, updated by D.D. Blackwell.
Related image
-
 The geothermal resources map of the w:en:United States.

Source
| This image is a work of a United States Department of Energy (or predecessor organization) employee, taken or made as part of that person's official duties. As a work of the U.S. federal government, the image is in the public domain.
Please note that national laboratories operate under varying licences and some are not free. Check the site policies of any national lab before crediting it with this tag.
|

|
http://www.eia.doe.gov/cneaf/solar.renewables/renewable.energy.annual/backgrnd/fig17.htm
w:en:Category:Images of the United States
Original upload log
| date/time | username | resolution | size | edit summary |
|---|---|---|---|---|
| 09:39, 4 May 2005 | w:en:User:SEWilco | 1892×1247 | 65 KB | The <a href="/wiki/Geothermal_%28geology%29" title="Geothermal (geology)">geothermal</a> resources map of the <a href="/wiki/United_States" title="United States">United States</a> below shows the estimated subterranean temperatures at a depth of 6 kilometers. To determine the Earth's internal temperature at any depth below the capabilities of normal wel |
Image description page history
File history
Click on a date/time to view the file as it appeared at that time.
| Date/Time | Thumbnail | Dimensions | User | Comment | |
|---|---|---|---|---|---|
| current | 13:24, 16 September 2007 | | 1,892 × 1,247 (65 KB) | BetacommandBot | Transwiki approved by: w:en:User:Dmcdevit This image was copied from wikipedia:en. The original description was: Heat Flow Contours of the United States. Drawing not to scale. Heat flow contours are patterned in intervals of 20 milliwatts per squa |