
File:CRISP-DM Process Diagram.png

Size of this preview: 598 × 599 pixels. Other resolutions: 240 × 240 pixels | 479 × 480 pixels | 767 × 768 pixels | 1,022 × 1,024 pixels | 2,044 × 2,048 pixels | 3,707 × 3,714 pixels.
Original file (3,707 × 3,714 pixels, file size: 608 KB, MIME type: image/png)
| This is a file from the Wikimedia Commons. Information from its description page there is shown below. Commons is a freely licensed media file repository. You can help. |
Summary
| Description |
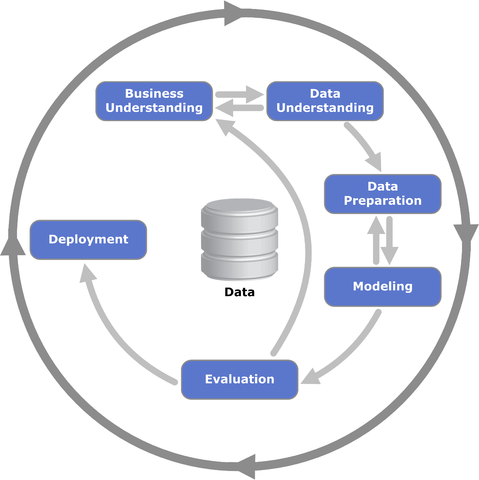
English: A diagram showing the relationship between the different phases of CRISP-DM and illustrates the recursive nature of a data mining project. |
| Date | |
| Source | Own work based on:ftp://public.dhe.ibm.com/software/analytics/spss/documentation/modeler/18.0/en/ModelerCRISPDM.pdf (Figure 1) |
| Author | Kenneth Jensen |
Licensing
I, the copyright holder of this work, hereby publish it under the following license:
This file is licensed under the Creative Commons Attribution-Share Alike 3.0 Unported license.
- You are free:
- to share – to copy, distribute and transmit the work
- to remix – to adapt the work
- Under the following conditions:
- attribution – You must give appropriate credit, provide a link to the license, and indicate if changes were made. You may do so in any reasonable manner, but not in any way that suggests the licensor endorses you or your use.
- share alike – If you remix, transform, or build upon the material, you must distribute your contributions under the same or compatible license as the original.
File history
Click on a date/time to view the file as it appeared at that time.
| Date/Time | Thumbnail | Dimensions | User | Comment | |
|---|---|---|---|---|---|
| current | 19:10, 1 March 2013 | | 3,707 × 3,714 (608 KB) | Kennethajensen | User created page with UploadWizard |
File usage
The following pages on the English Wikipedia use this file (pages on other projects are not listed):
Global file usage
The following other wikis use this file:
- Usage on bg.wikipedia.org
- Usage on es.wikipedia.org
- Usage on pt.wikipedia.org
- Usage on ru.wikipedia.org
- Usage on sv.wikipedia.org
- Usage on uz.wikipedia.org